

At first glance, national and international datasets on teachers and principals seem to tell similar stories. However, these averages can mask meaningful differences. Disaggregating the data helps us see the variation that actually shapes school experiences and system performance.
The National Center for Education Statistics (NCES) has conducted two different studies designed to produce key benchmark data about K-12 public and private school teachers and principals: the Teaching and Learning International Survey (TALIS) and the National Teacher and Principal Survey (NTPS). Both of these studies focus on the characteristics, qualifications, workplace experiences, climate, goals, and perceptions of teachers and principals. TALIS is designed to compare data across different countries, while the NTPS provides comparisons within the United States; both of these studies are vital for understanding the K-12 workforce.
Data sources: TALIS vs. NTPS
TALIS and NTPS differ in the types of comparisons they facilitate. TALIS is sponsored by the Organization for Economic Cooperation and Development (OECD). Data collection is coordinated between nearly 50 countries, including the United States. In the U.S., TALIS surveys lower secondary teachers, that is, teachers of students in grades 7, 8, or 9 and their principals since this grade range corresponds to the focus of the survey on International Standard Classification of Education [ISCED] Level 2.
Conversely, the NTPS collects data solely within the United States. Its large sample size allows for comparisons between subgroups such as elementary, lower secondary, and upper secondary teachers, school sector (i.e., traditional public or public charter schools, private school affiliation), and even states. To support these comparisons, a large sample size is needed. For example, the 2017-18 NTPS sampled about 14,000 public and private schools compared to approximately 220 for the 2018 TALIS.
There are additional differences between these two studies. For more information, please see the detailed technical notes about the 2017-18 NTPS and 2018 TALIS to learn more information about data collection operations, sampling and weighting, exact question wording, and other factors that may contribute to differences.
While both of these studies have been administered relatively recently (NTPS in 2020-21 and TALIS in 2024), this analysis looks at the same school year for both studies: the 2017-18 school year.
Teacher and principal gender
Both TALIS and NTPS asked teachers and principals whether they were male or female, both questionnaires provided only these two response options, and neither survey used the term “sex” or “gender” in the questions. However, for this blog analysis, the construct is referred to as “gender.”
What differences are hidden below these headlines?
Comparing the United States average to the international TALIS average belies differences. While there is no statistical difference between the overall and U.S. percentage of principals who are female (48 and 47 percent, respectively), there are notable differences between the U.S. and individual countries that we could not know without country-by-country comparisons! These numbers range from 7 percent in Japan and Turkey to 77 percent in Brazil and 84 percent in Lativia.
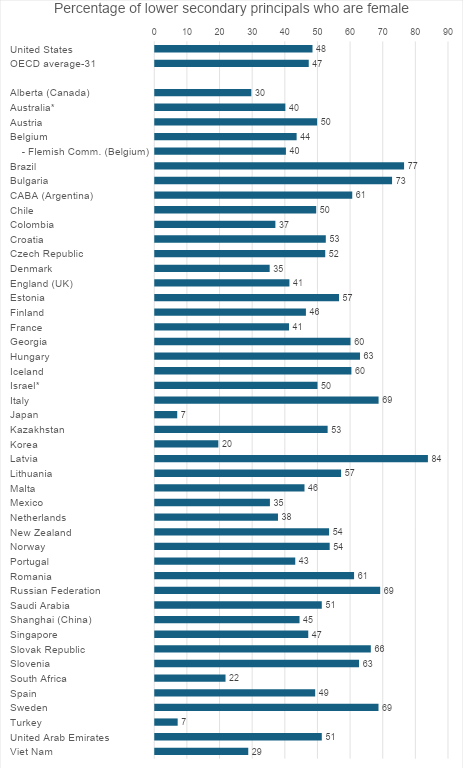
SOURCE: 2018 TALIS
While the small difference between the percentage of lower secondary teachers who are female is statistically significant between the United States and all TALIS countries (68 and 66 percent, respectively), it is again important to look at differences within the internal TALIS average. Compared to principals, the percentage range of female teachers is more narrow: 42 percent in Japan to 89 percent in Latvia.
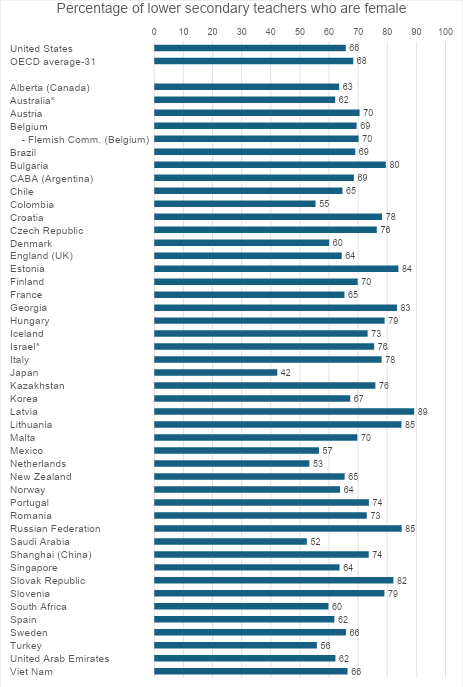
SOURCE: 2018 TALIS
Similarly, NTPS shows large differences in the percentages of female principals and teachers across states.
Across the nation, an average of 54 percent of public school principals are female, but this ranges from just 33 percent in Indiana to 78 percent in Louisiana and 79 percent in Washington, D.C.
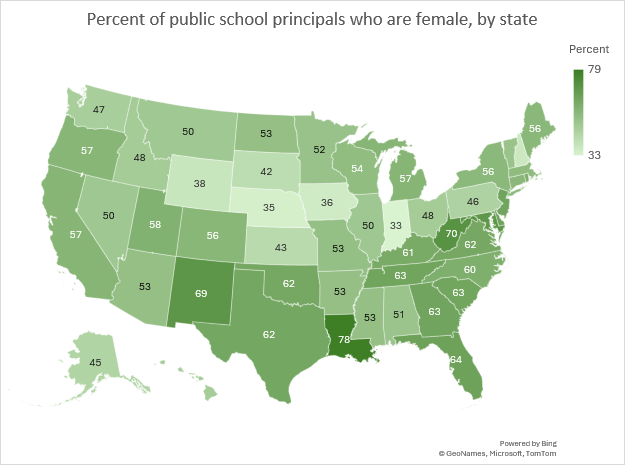
SOURCE: 2017-18 NTPS
Although 77 percent of public school teachers in the U.S. are female, there is a narrower range across states compared to principals. In Wyoming, 68 percent of public school teachers are female, ranging up to 83 percent in South Carolina. Because of low survey response rates this map does not include data for Maryland or the District of Columbia (which had one of the highest rates of female principals).
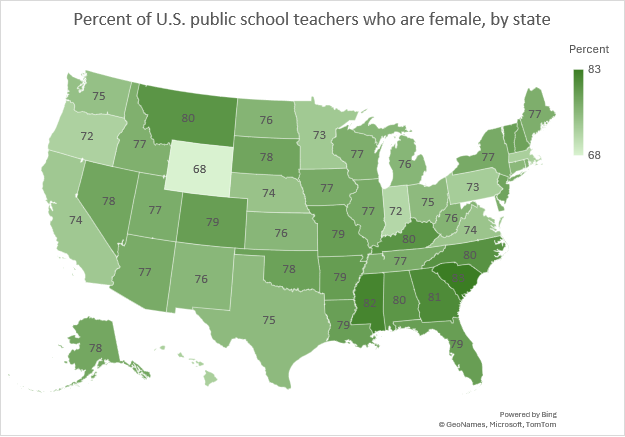
SOURCE: 2017-18 NTPS
Wait, why are TALIS and NTPS estimates so different?
The populations are different! Recall that in the United States, TALIS only samples ISCED Level 2 teachers (lower secondary, or 7,8, and 9th grade teachers) so the 2018 U.S. administration of TALIS excludes elementary and upper secondary teachers and their schools, which are sampled for NTPS. Further disaggregating the NTPS data shows why this is relevant.
By looking at the distribution of female principals and teachers by their school level, it appears that the difference in target populations explains much of the differences between the findings for TALIS versus NTPS. For example, in primary public schools in the United States, higher percentages of both principals and teachers are female than in either middle or high schools. About 67 percent of public school PRINCIPALS in primary schools are female, compared to 40 percent in middle schools and 33 percent in elementary schools.
Lower secondary TEACHERS may work in middle, high, or combined schools (depending on the other grades offered by the schools). Excluding primary schools creates a population of lower secondary school teachers who are, on average, less likely to be female than the overall population in all K-12 schools.
In particular, 89 percent of teachers in public primary schools are female, compared to just 72 percent in middle and 60 percent in high schools.
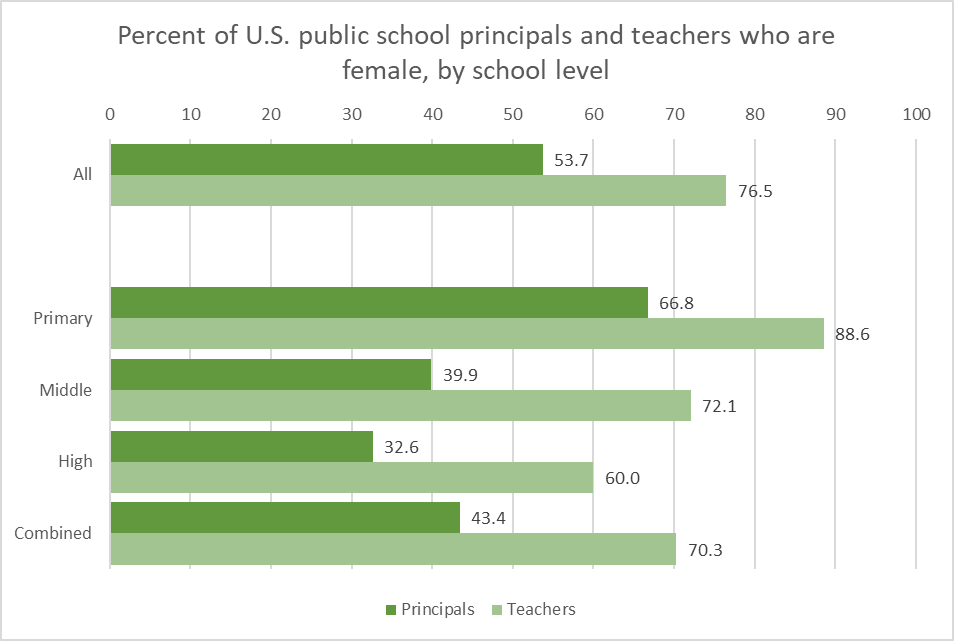
SOURCE: 2017-18 NTPS
Primary schools are those with at least one grade lower than 5 and no grade higher than 8. Middle schools have no grade lower than 5 and no grade higher than 8. High schools have no grade lower than 7 and at least one grade higher than 8. Combined schools are those with at least one grade lower than 7 and at least one grade higher than 8, or with all students in ungraded classrooms.
Future comparisons and considerations
We only discuss principal and teacher gender here, but there are other comparisons that can be made!
Both NTPS and TALIS measure key concepts such as staff demographics, education and training, school climate, professional development and support, and other important topics. For some of these areas, there may be relatively little variation within or across countries, or there may be relatively little variation between lower secondary teachers and those who provide instruction to elementary or upper secondary grades, but we can only learn that by looking under the hood!
Summary statistics alone are not enough to fully understand what they’re describing; it’s important to disaggregate the data in order to understand the full story.
Leave a Reply