

Understanding Charter Schools Through Federal Education Data
Charter schools are publicly-funded schools that operate independently of the traditional public school system. They are established based on a charter or contract with a state or local authority and are often granted greater flexibility in operations in exchange for increased accountability for performance.
One of the best sources of data to understand the magnitude of charter school implementation in the United States is the Common Core of Data (CCD) housed in the National Center for Education Statistics (NCES) under the U.S. Department of Education. The CCD is the Department’s primary database on public elementary and secondary education in the United States. Among its many variables, CCD captures whether a school is classified as a charter school and its corresponding enrollment figures. This rich dataset provides valuable insights into the growth, geographic distribution, and demographic makeup of charter schools nationwide.
Charter School Enrollment: A Decade of Growth
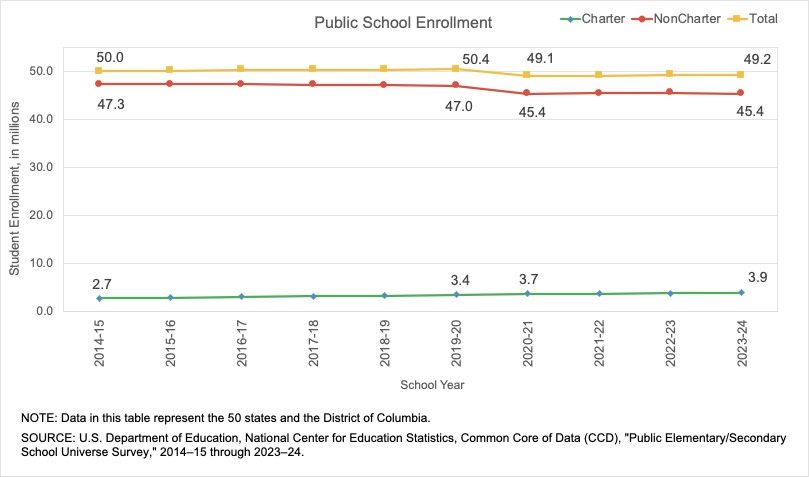
The line chart below, based on CCD figures, reveals an upward trend in charter school enrollment over the past ten years across the 50 states and the District of Columbia. From School Year (SY) 2014–15 to SY 2023-24, the number of students enrolled in charter schools increased from 2.7 to 3.9 million students. During this same period, the total number of students enrolled in public schools decreased from 50.0 to 49.2 million students.
Charter Trends Vary by State
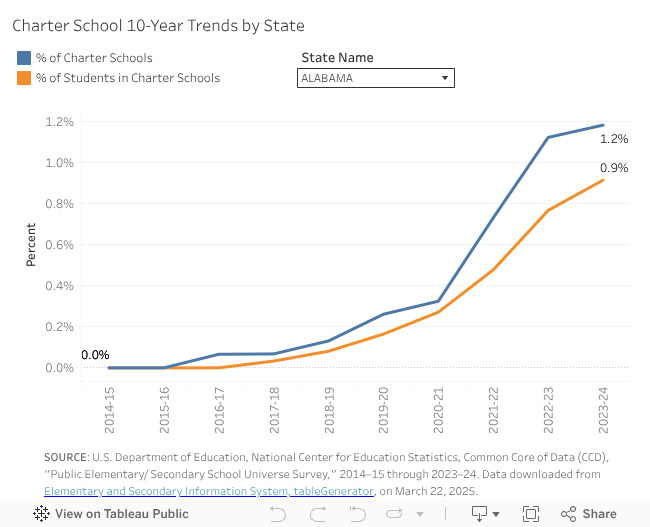
Looking at the state-level trends, the story is more nuanced. As shown in the interactive Tableau dashboard, both the percentage of schools that were charters and the percentage of students attending them was higher in many states in SY 2023–24 than in 2014–15. Other states (e.g., WV) have only started offering charter school instruction in recent years. As of fall 2023, forty-five states and the District of Columbia had passed public charter legislation (the exceptions were Montana, Nebraska, North Dakota, South Dakota, and Vermont). There are many state-centric reasons for these variations including differences in state policies, authorizing bodies, and/or public sentiment regarding school choice.
Charter and Non-Charter Schools: Different Student Demographics
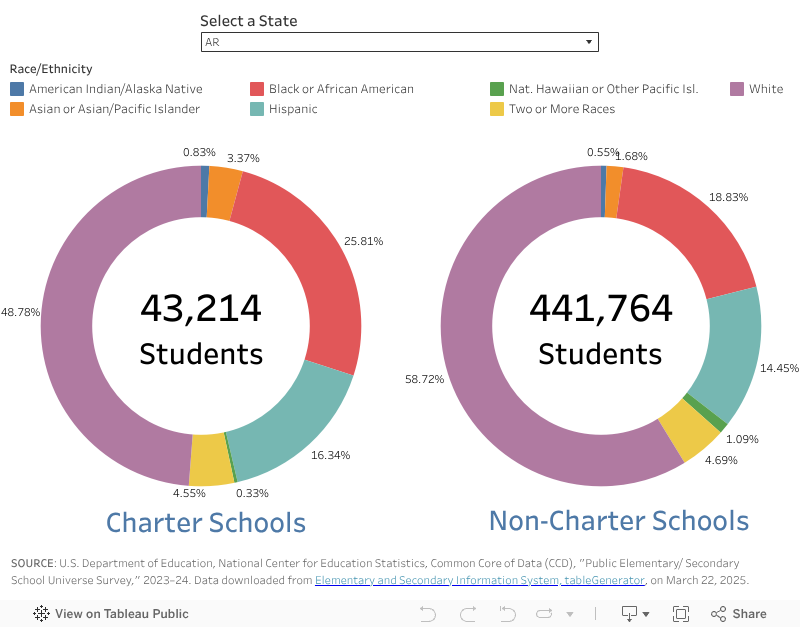
The CCD also provides the data to review the racial composition of students in charter and non-charter schools. Use the Tableau dashboard to explore charter/non-charter comparisons for SY 2023–24. As with the overall prevalence of charter schools, the differences in race/ethnicity may reflect the geographic location of charter schools, parental preferences, and broader patterns of access in public education.
Closing Thoughts: Tracking Charter Enrollment Trends
Charter schools continue to play an evolving role in the U.S. public education system, and the CCD offers a powerful lens for understanding that evolution. From national enrollment trends to state-level patterns and demographic insights, the CCD provides a comprehensive and reliable source of information. For researchers, policymakers, and anyone interested in education, this dataset opens the door to deeper analysis and exploration of how charter schools are shaping—and being shaped by—the broader public education landscape.
DISCLAIMER: This blog was created independently and is not associated with or representing the Common Core of Data or National Center for Education Statistics.
Leave a Reply