

As researchers, we want data to be timely, relevant, and actionable without sacrificing quality. That is, we want data to be both fast and good. For parents, teachers, and researchers, understanding how K-12 education changed during the COVID-19 pandemic is a key example of those considerations. Data users don’t want to wait years to gain access to official statistics about these topics.
Here, I look at the impact of abbreviated data processing procedures on survey estimates. That is, would releasing data sooner, but with fewer data processing activities, change findings?
(Answer: Not always, but there are many factors you should consider first!)
Test case: 2020-21 National Teacher and Principal Survey (NTPS)
The National Teacher and Principal Survey (NTPS) collects data from public and private K-12 school staff over the course of a full school year. For example, the 2020-21 NTPS was conducted from the fall of 2020 through August 2021. Reports describing the results of school, principal, and teacher surveys were published in December 2022 following data editing, imputation, non-response adjusted weighting, and internal review. For an example, see Taie and Lewis (2022).
Because the coronavirus pandemic began in the spring of 2020 and NTPS data collection was scheduled for the fall of 2020, the questionnaires asked principals and teachers how their schools first adapted to COVID-19. School staff reported, subjectively, whether they had the support and resources they needed to be effective at their jobs during the spring of 2020. The surveys also asked about actions that schools and teachers took, such as changing the mode in which classes were taught, the type of real-time interactions teachers had with students, and whether schools facilitated students’ access to computers and the internet.
Preliminary vs. final Data: What’s different?
Preliminary estimates appear in the report “Impact of the Coronavirus (COVID-19) Pandemic on Public and Private Elementary and Secondary Education in the United States (Preliminary Data): Results from the 2020-21 National Teacher and Principal Survey (NTPS),” published in February 2022 (Berger et al. 2022). Although the original survey data were edited, missing data were not imputed. Because the interim data files were not published, the underlying data files did not undergo perturbation (i.e., swapping values, adding noise, or otherwise reducing the risk that researchers with access to data files could identify any individual respondent). Weights help ensure that analyses are generalizable to the full sample frame regardless of whether a sample member is selected for or completes a survey. For the preliminary analysis, weights accounted for schools’ and teachers’ probability of selection only and were not adjusted for nonresponse. Finally, standard errors and variance for the NTPS are typically calculated using jackknife replication. For the preliminary report, teacher variance estimation was computed using an estimated root design effect (DEFT). For more details about these data processing and weighting activities, see “Documentation for the 2020-21 National Teacher and Principal Survey (Cox et al 2024).”
Note that the survey questions were retrospective about the spring of 2020 and the NTPS was conducted through the 2020-21 school year, so even an immediate release of preliminary data would describe the state of education from over a year earlier. We are not suggesting that this timeline is actionable for schools to immediately react to COVID-19, but it serves as an example where releasing findings more quickly, but with less processing, may be appropriate.
Analysis: Teachers’ perspectives
Here, we look at teachers’ and principals’ opinions about the previous school year. During the 2020-21 NTPS, where applicable, they were asked the extent to which they agreed or disagreed that “I had the support and resources I needed to be effective as [a teacher at/the principal of] this school during the coronavirus pandemic in the 2019-20 school year.”
The tables below show the preliminary data as reported by Berger et al. (2022), and the final estimates were generated within DataLab. All numbers in the preliminary report were rounded to the nearest whole number, so the final estimates below are also rounded to the nearest whole number. Rounded estimates that differ between the preliminary and final data are highlighted.
First, we look at public school teachers in Table 1.
Table 1. Percentage of public school teachers who reported the extent to which they agreed with having the support and resources they needed to be effective as the principal of their school during the COVID-19 pandemic, preliminary and final data
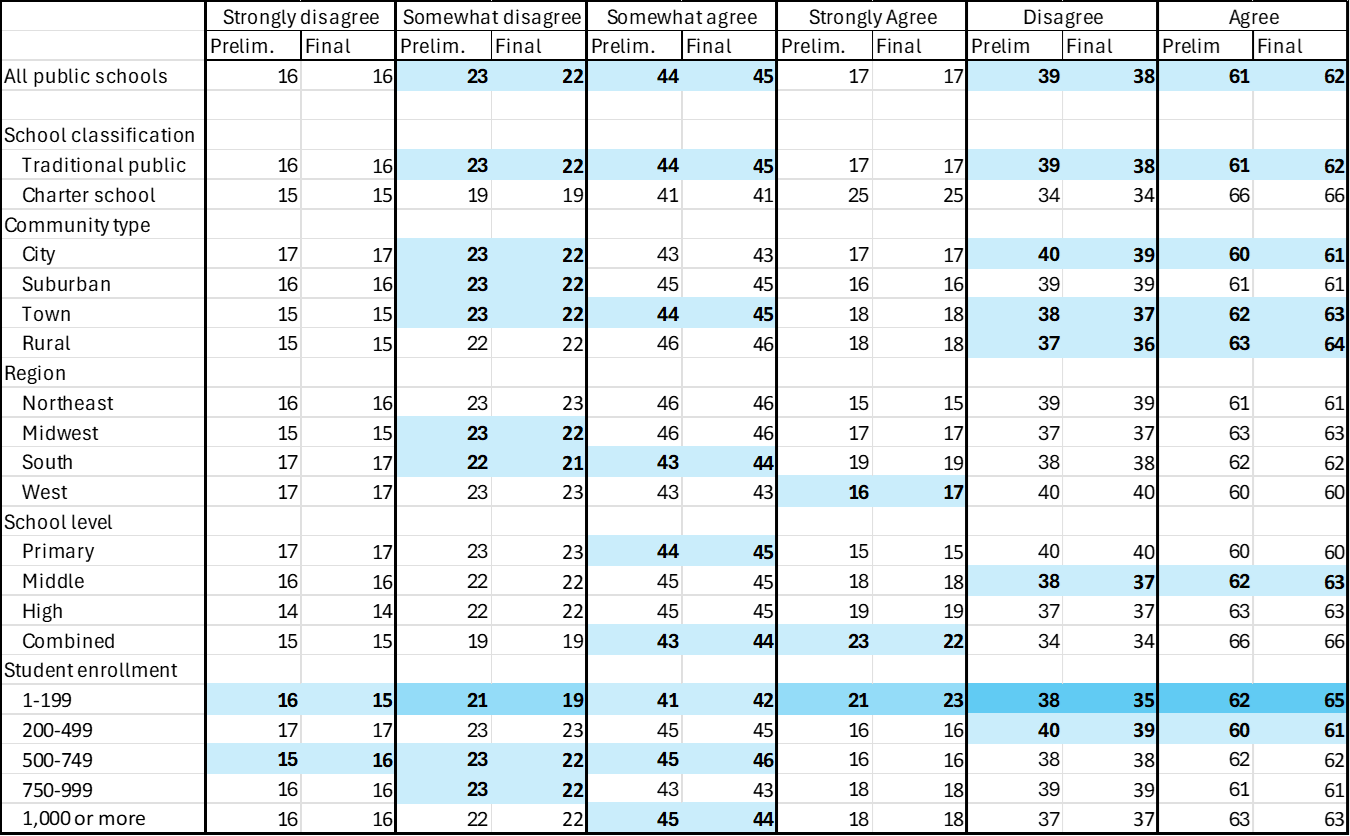
Preliminary estimates from Berger et al. (2022). Final estimates generated from National Teacher and Principal Survey (NTPS) Public School Teachers, 2020-21” using DataLab (https://nces.ed.gov/datalab/).
Overall, 120 pairs of estimates appear in the table (note that 80 are unique; the final two columns collapse the “strongly” and “somewhat” categories). Of those estimates, 40, or one third, changed by at least one percentage point. The only point estimates that changed by more than 1 point are for teachers in schools with fewer than 200 students, a relatively uncommon occurrence. The final estimate for whether a teacher agreed/disagreed differs by 3 percentage points, with a 2 point decrease for those who somewhat disagree and a 2 point increase for those who strongly agree.
Overall, these differences have little practical significance, that is, both the preliminary and final data convey that teachers largely reported being satisfied, particularly those who taught in small schools or public charter schools.
In addition to practical significance, we can look at statistical significance. One pair of estimates showed a statistically significant change between the preliminary and final estimates: among all public school teachers, there was a 1 percentage point difference in those who somewhat disagreed (23 percent and 22 percent, respectively).
How is a 1 percentage point difference statistically significant?
Approximately 40,000 public school teachers responded to the 2020-21 NTPS (Cox et al. 2024), so we attribute this difference to the large sample size. Whether 23 or 22 percent of public teachers somewhat disagreed may be statistically significant but has little or no practical significance in order to understand the broad implications of COVID-19 on teachers in a timely manner.
Analysis: Principals’ perspectives
Table 2 makes the same preliminary to final comparisons for public school principals.
Table 2. Percentage of public principals who reported the extent to which they agreed with having the support and resources they needed to be effective as the principal of their school during the COVID-19 pandemic, preliminary and final data
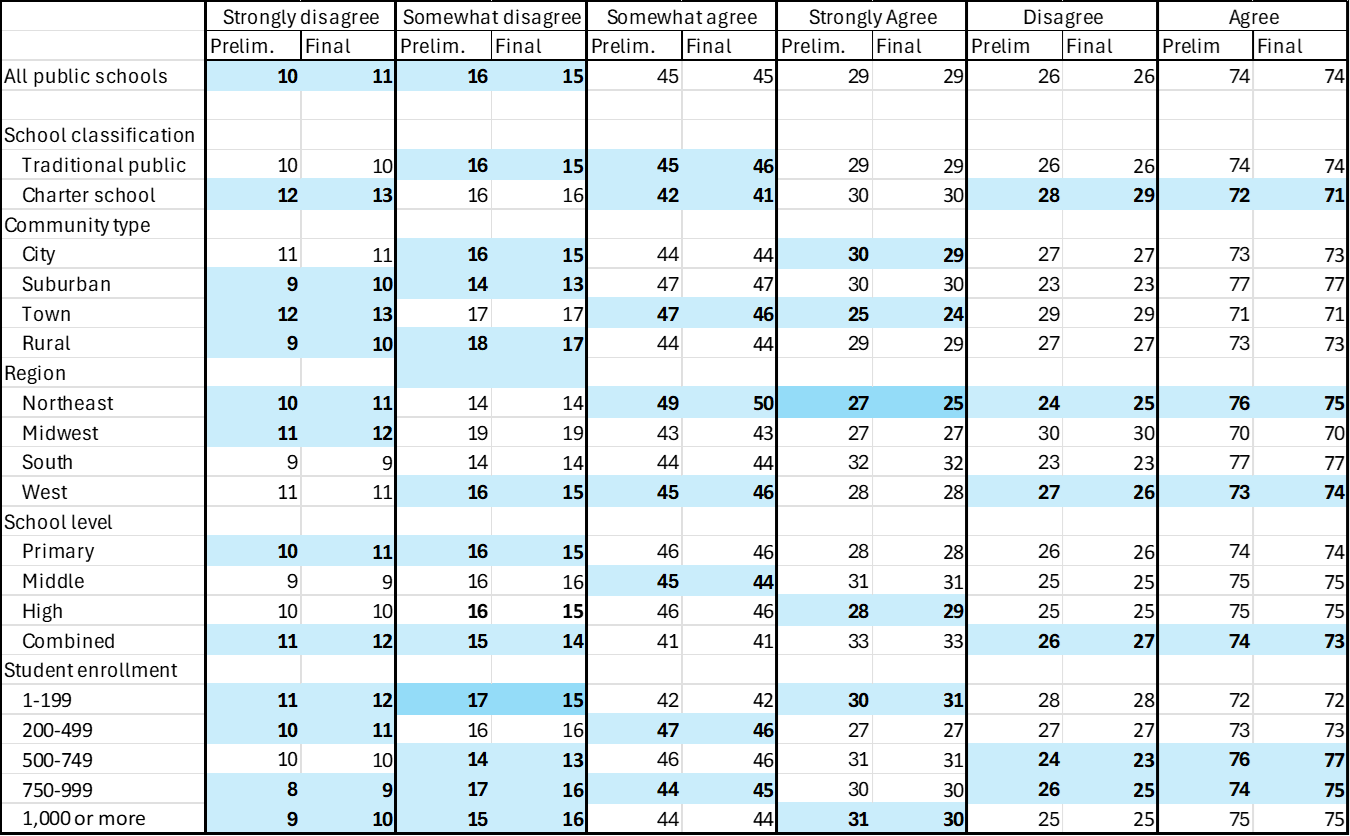
Preliminary estimates from Berger et al. (2022). Final estimates generated from National Teacher and Principal Survey (NTPS) Public School Principals, 2020-21” using DataLab (https://nces.ed.gov/datalab/).
For principals, we see that 51 of 120 estimate pairs, about 43 percent, changed by at least one percentage point. This includes only two statistics that changed by more than one point: the percentage of public school principals in the northeast who strongly agreed changed from 27 to 25 percent between the preliminary and final estimates and the percentage in schools with fewer than 200 students who somewhat disagreed changed from 17 to 15 percent. No differences were statistically significant.
As with teachers, the magnitude of these changes are not critical for understanding principals’ overall perspective on the support and resources they first received.
So, can data processing steps be skipped in order to release data sooner?
As social scientists like to say, “it depends!”
Firstly, timely data is particularly important for this topic. Differences of 1-2 points may be offset by the need for data sooner, but not worth the tradeoff in all cases. This is particularly true for data published as official statistics, point estimates used by legislators, for key research, and for smaller estimates for which a 1-2 point difference is relatively larger. Consider this scenario: in the 2020-21 school year, 6.1 percent of public school teachers were Black. If that was mistakenly reported as 4.1 percent or 8.1 percent,, there would be a different, but incorrect, understanding of the teaching workforce.
Next, we plan to examine whether other questions about COVID in the 2020-21 NTPS demonstrate practical or statistical significance when comparing preliminary and final estimates; stay tuned! More detailed analysis about other survey estimates that do not appear in the preliminary report, multivariate analysis, or disentangling different data processing procedures would require access to restricted-use or internal data files, and we encourage analysts with access to those materials to explore this further.
Technical notes for data nerds:
The overall sample size and relative size of key subgroups should be considered. Approximately 40,000 public school teachers and 6,500 public school principals responded to the 2020-21 NTPS (Cox et al. 2024). Subgroups with smaller denominators are particularly vulnerable to variance, so the risk of error increases as the population size decreases (but this does not guarantee a strict relationship between sample size and potential changes in estimates).
In addition, this analysis examines point estimates only. Multivariate analysis or other more complex techniques may be more vulnerable to changes when using preliminary vs. final data.
However, there is value to exploring the impacts of different data processing procedures on survey estimates.
_____________________________________________________________________________________________________
Berger, M., Kuang, M., Jerry, L., and Freund, D. (2022). Impact of the Coronavirus (COVID-19) Pandemic on Public and Private Elementary and Secondary Education in the United States: Results from the 2020–21 National Teacher and Principal Survey (NCES 2022-019). U.S. Department of Education. Washington, DC: National Center for Education Statistics.
Cox, S., Gilary, A., Mosina, S., Rhea, J., Simon, D., Thomas, T., and Zhang, C. (2024). Documentation for the 2020–21 National Teacher and Principal Survey (NTPS) (NCES 2024-024). U.S. Department of Education. Washington, DC: National Center for Education Statistics.
Taie, S., and Lewis, L. (2022). Characteristics of 2020–21 Public and Private K–12 School Teachers in the United States: Results from the National Teacher and Principal Survey First Look (NCES 2022-113). U.S. Department of Education. Washington, DC: National Center for Education Statistics.
Leave a Reply