

The Organisation for Economic Co-operation and Development (OECD) releases a major statistical report every September comparing education across the OECD member countries and several partner countries. Their more than 500 page report, Education at a Glance (EAG), contains detailed indicators and analyses highlighting key statistics covering early childhood education through postsecondary and adult education. The indicators address a range of specific topics, such as enrollment rates, completion rates, teacher salaries and staffing, education expenditures, fields of study, and employment rates. An important focus of the 2025 edition is outcomes of education which includes new 2023 Programme for the International Assessment of Adult Competencies (PIAAC) data on adult literacy.
The new 2023 PIAAC assessments of adult literacy show that the U.S. adult literacy was about the same as the average across OECD countries, lower than the highest scoring countries such as Finland, Japan, and Sweden, but higher than other OECD countries such as Poland, Portugal, and Chile. Among G7 countries, the United States literacy average (258) was lower than Japan (288), England/U.K. (271), Canada (270), and Germany (265), but higher than France (252) and Italy (243).
Figure 1. Average literacy score of 25- to 64-year-old adults, by OECD country or area: 2023
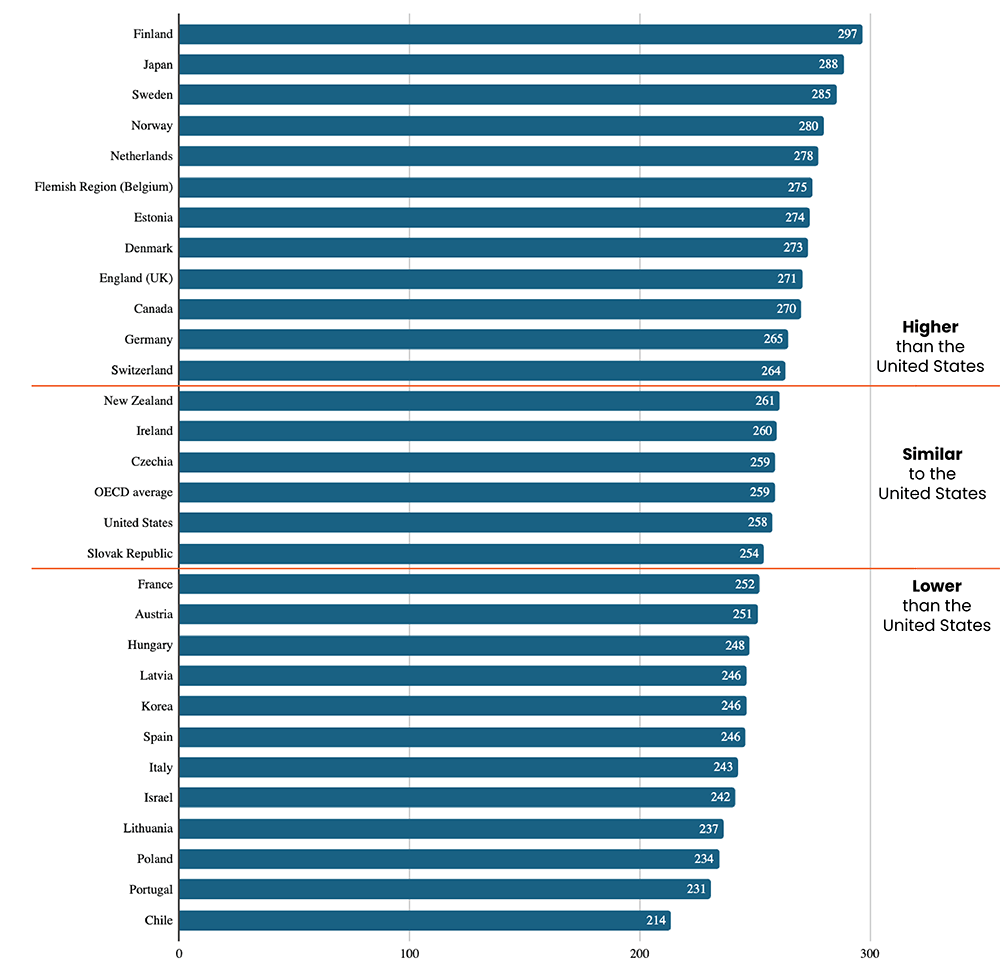
SOURCE: Organisation for Economic Co-operation and Development, Education at a Glance, 2025, International Assessment of Adult Competencies (PIAAC)
PIAAC data show that despite rising levels of educational attainment across most OECD countries, literacy and numeracy skills of adults either declined or showed no change. Among the 26 OECD countries and economies participating in PIAAC, adult literacy skills declined in the United States and 18 other OECD countries between 2012 and 2023. Only 3 countries including Denmark, Finland, and Sweden showed increases, while the remaining 4 countries had no measurable change.
The average literacy score among older adults in the United States was higher than the OECD average, while the average literacy score among younger adults was lower than the OECD average. The average literacy score among adults 55-64 years of age in the United States (248) was 6 points higher than the OECD average, while the literacy average score among young adults of 25-34 years of age (265) was about 6 points lower than the OECD average. While the average literacy score of young adults in the United States was higher than the average for older adults, the difference was not as large as in most other OECD countries.
As might be expected, people with higher levels of educational attainment showed higher average literacy levels. Across OECD countries about 61% of adults who had not completed high school performed at level 1 or below in literacy meaning that they could, at most, only understand short texts on familiar topics. Even among those who had completed high school, about 30% scored at this low level and even 13% of those with some postsecondary education exhibited such low levels of literacy. The United States percentages of adults with low levels of literacy among those who had not completed high school (75%) or only high school (35%) were higher than the OECD averages, while the percentage of adults with low literacy among those with some postsecondary education was about the same (13%).
Higher levels of educational attainment among adults were associated with higher employment rates across OECD countries. For example, 86% of adults who had completed a bachelor’s or equivalent degree were employed, compared to 78% of those who had completed only high school. While this general pattern held for the United States, the employment rates were lower than the OECD average across educational attainment levels, with the largest gap at the high school level. The employment rates for U.S. persons who had completed a bachelor’s degree (83%) was 3 points lower than the OECD average, while the U.S. employment rate for those with only a high school credential (70%) was about 7 points lower than the OECD average.
Figure 2: Employment rate of 25- to 64-year-old adults who had completed only a high school credential, by OECD country: 2024
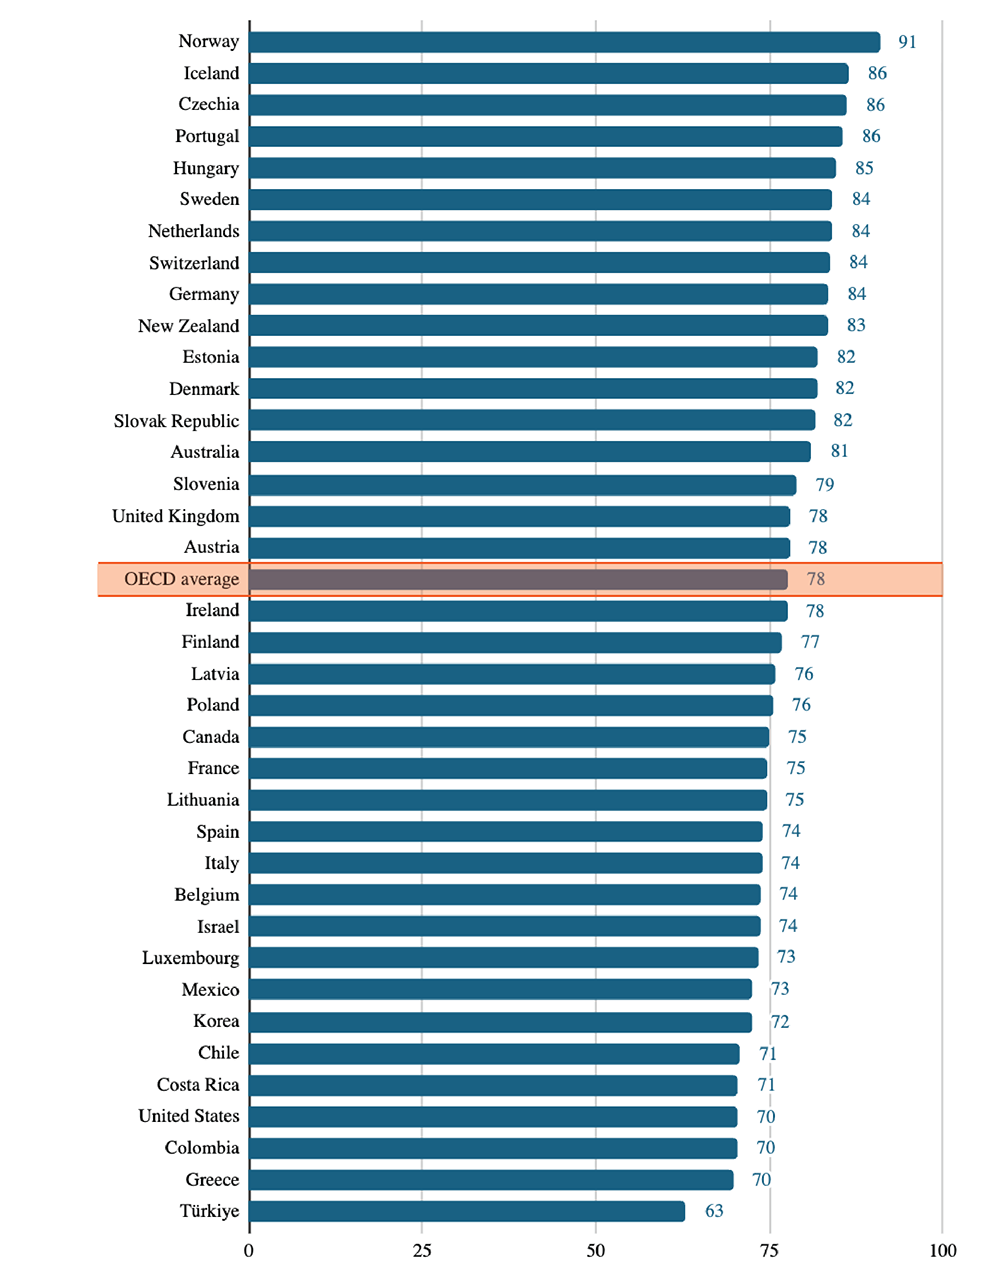
SOURCE: Organisation for Economic Co-operation and Development, Education at a Glance, 2025, Indicator A3.
While the U.S. education system indicators tracked closely to the OECD average in many areas, there were important areas where the U.S. system markedly differed from international averages. At the early childhood level, the U.S. enrollment rate of 3- to 5-year-olds (64%) was substantially below the international average (85%). This difference was accentuated by high early childhood education participation rates in many OECD countries, with 14 of the 38 OECD countries reporting participation rates of 95% or higher.
Figure 3. Percent of 3- to 5-year-olds enrolled in early childhood education programs: 2023
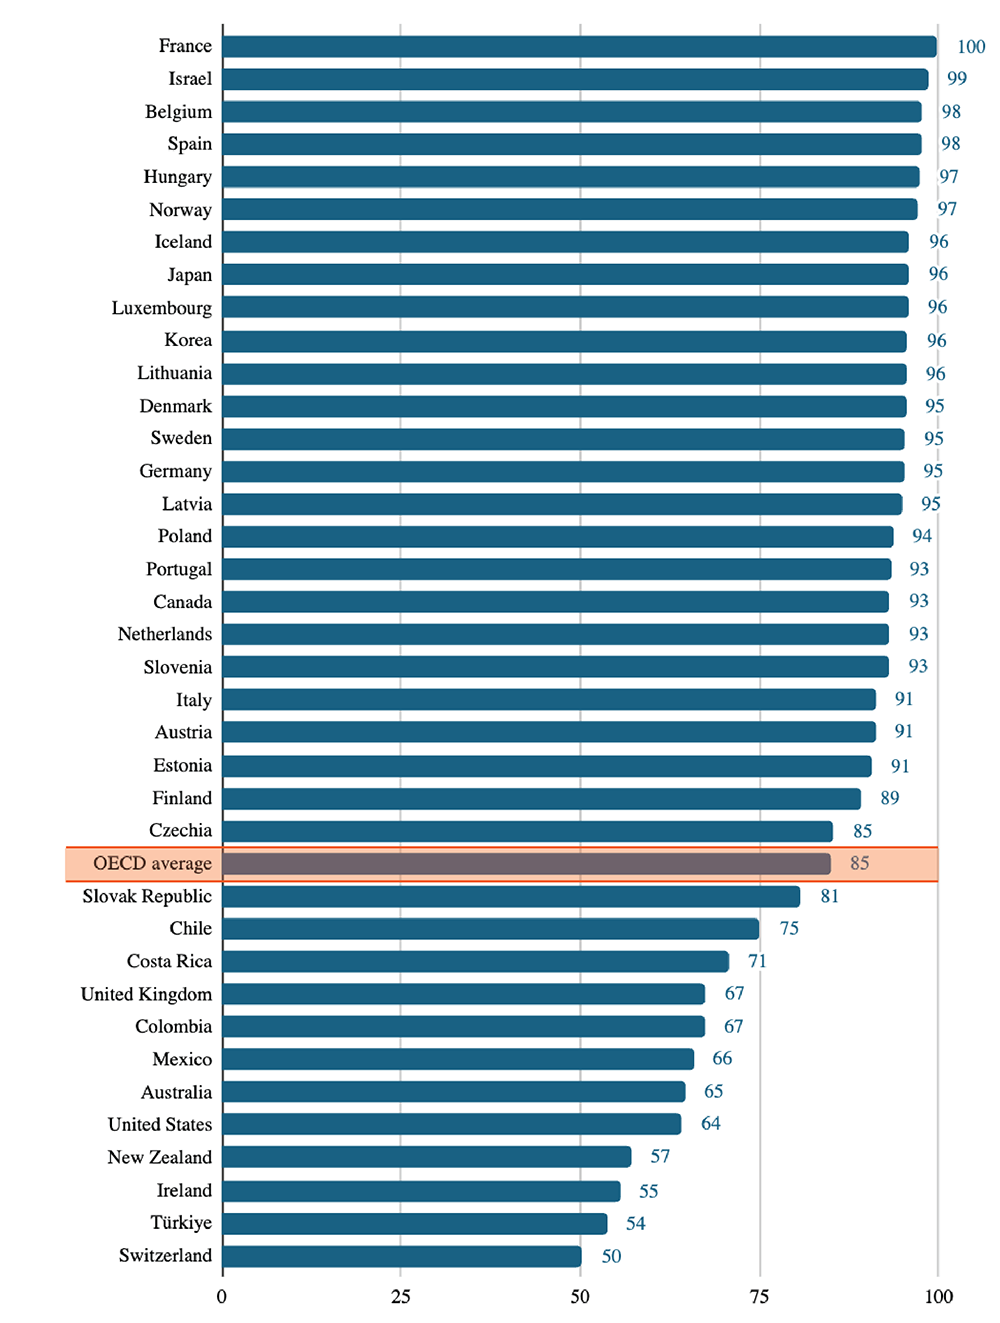
SOURCE: Organisation for Economic Co-operation and Development, Education at a Glance, 2025, Indicator B1.
In contrast to low participation rates in early childhood programs, high percentages of adults in the United States participated in adult education in 2023. About 85 percent of U.S. adults with high levels of literacy had participated in adult education during the prior year compared to 70 percent of their peers in other OECD countries. This pattern was consistent across all literacy levels. Even U.S. adults with low levels of literacy (PIAAC levels 1 or below) participated in adult education during the prior year at higher rates (36%) than their peers in other OECD countries (26%).
Expenditures on educational institutions in the United States were relatively high compared to other OECD countries. At the elementary and secondary level, the average total public and private expenditure per student was $15,799 in the United States, about 17 percent higher than the OECD average ($13,527). Other OECD countries with much higher average expenditures per student at the elementary and secondary level included Luxembourg ($29,238) and South Korea ($22,486). Some countries like Canada ($15,778) and United Kingdom ($15,416) reported expenditures per student similar to the United States. In contrast, the U.S. expenditure per student at the postsecondary level ($31,610) was more than double the OECD average of $14,512. Only Luxembourg ($35,862), the United States, and the United Kingdom ($28,762) had values that exceeded $20,000 per student.
International comparisons offer a valuable perspective on trends in the U.S. education system. The OECD statistical indicators highlight areas where the U.S. experience mirrors patterns across other developed countries, as well as areas where the U.S. data show important differences. While statistical indicators alone cannot provide solutions to complex societal challenges, they do identify areas where more detailed analyses and policy studies may be fruitful.
Leave a Reply