

The numbers are on the rise…
No, not just the temperature… It’s also summer melt… that phenomenon where, even right now, somewhere in the US a student who was planning to start college this fall is thinking that maybe they just won’t go, or maybe they will try again in a semester or two. Summer melt means that an estimated 10-40% of students who enrolled will not attend college as planned1 this fall term, with perhaps the highest percentages in first-generation college students and community college students. Students who change their enrollment decisions start rethinking their plans as early as the spring, but some decisions happen as late as the beginning of the fall semester, when expected enrollees never show up for classes for which they’ve registered and maybe even paid deposits. So the numbers rise throughout the summer.
This is a worrying phenomenon and has been a problem for years. However, a new concern is that, with cuts to federal data collection and federal data availability, the extent of the issue won’t be adequately understood moving forward. Real impacts will result from colleges and universities not having the statistics they need.
Summer melt means not just missed opportunities for the students; it also impacts institutions’ bottom lines because they depend on tuition for many student services. These student services in turn impact student experience, creating a vicious cycle that can tank enrollments over time. In some cases, institutions do not know how many students are actually going to show up, one parent recently told me after an orientation visit. Schools then sometimes “overfill” dormitories, in a move reminiscent of the airline industry’s overselling of flights. Then when students move in, rooming assignments have been shuffled around, right when students’ commitment to the campus is at its most tenuous.
In other cases, under-enrollment leads to consolidation and closures of some academic programs, which can leave some students, like one Midwest student I recently spoke to, feeling like their degree offerings at admissions were a bait-and-switch. This can increase their chances of transferring to other institutions, like this student planned to do.
How do we know why students don’t show up?
We ask them. We collect the data.
This can be done through direct means like surveys,2 or indirect means like web-scraping of social media or combing through institutional-level data on who enrolled and sent in their deposit check, and who attended classes.3 Some of these methods are more labor-intensive than others, and some methods provide a clearer picture of the reasons for summer melt patterns at a given institution or in a given year.
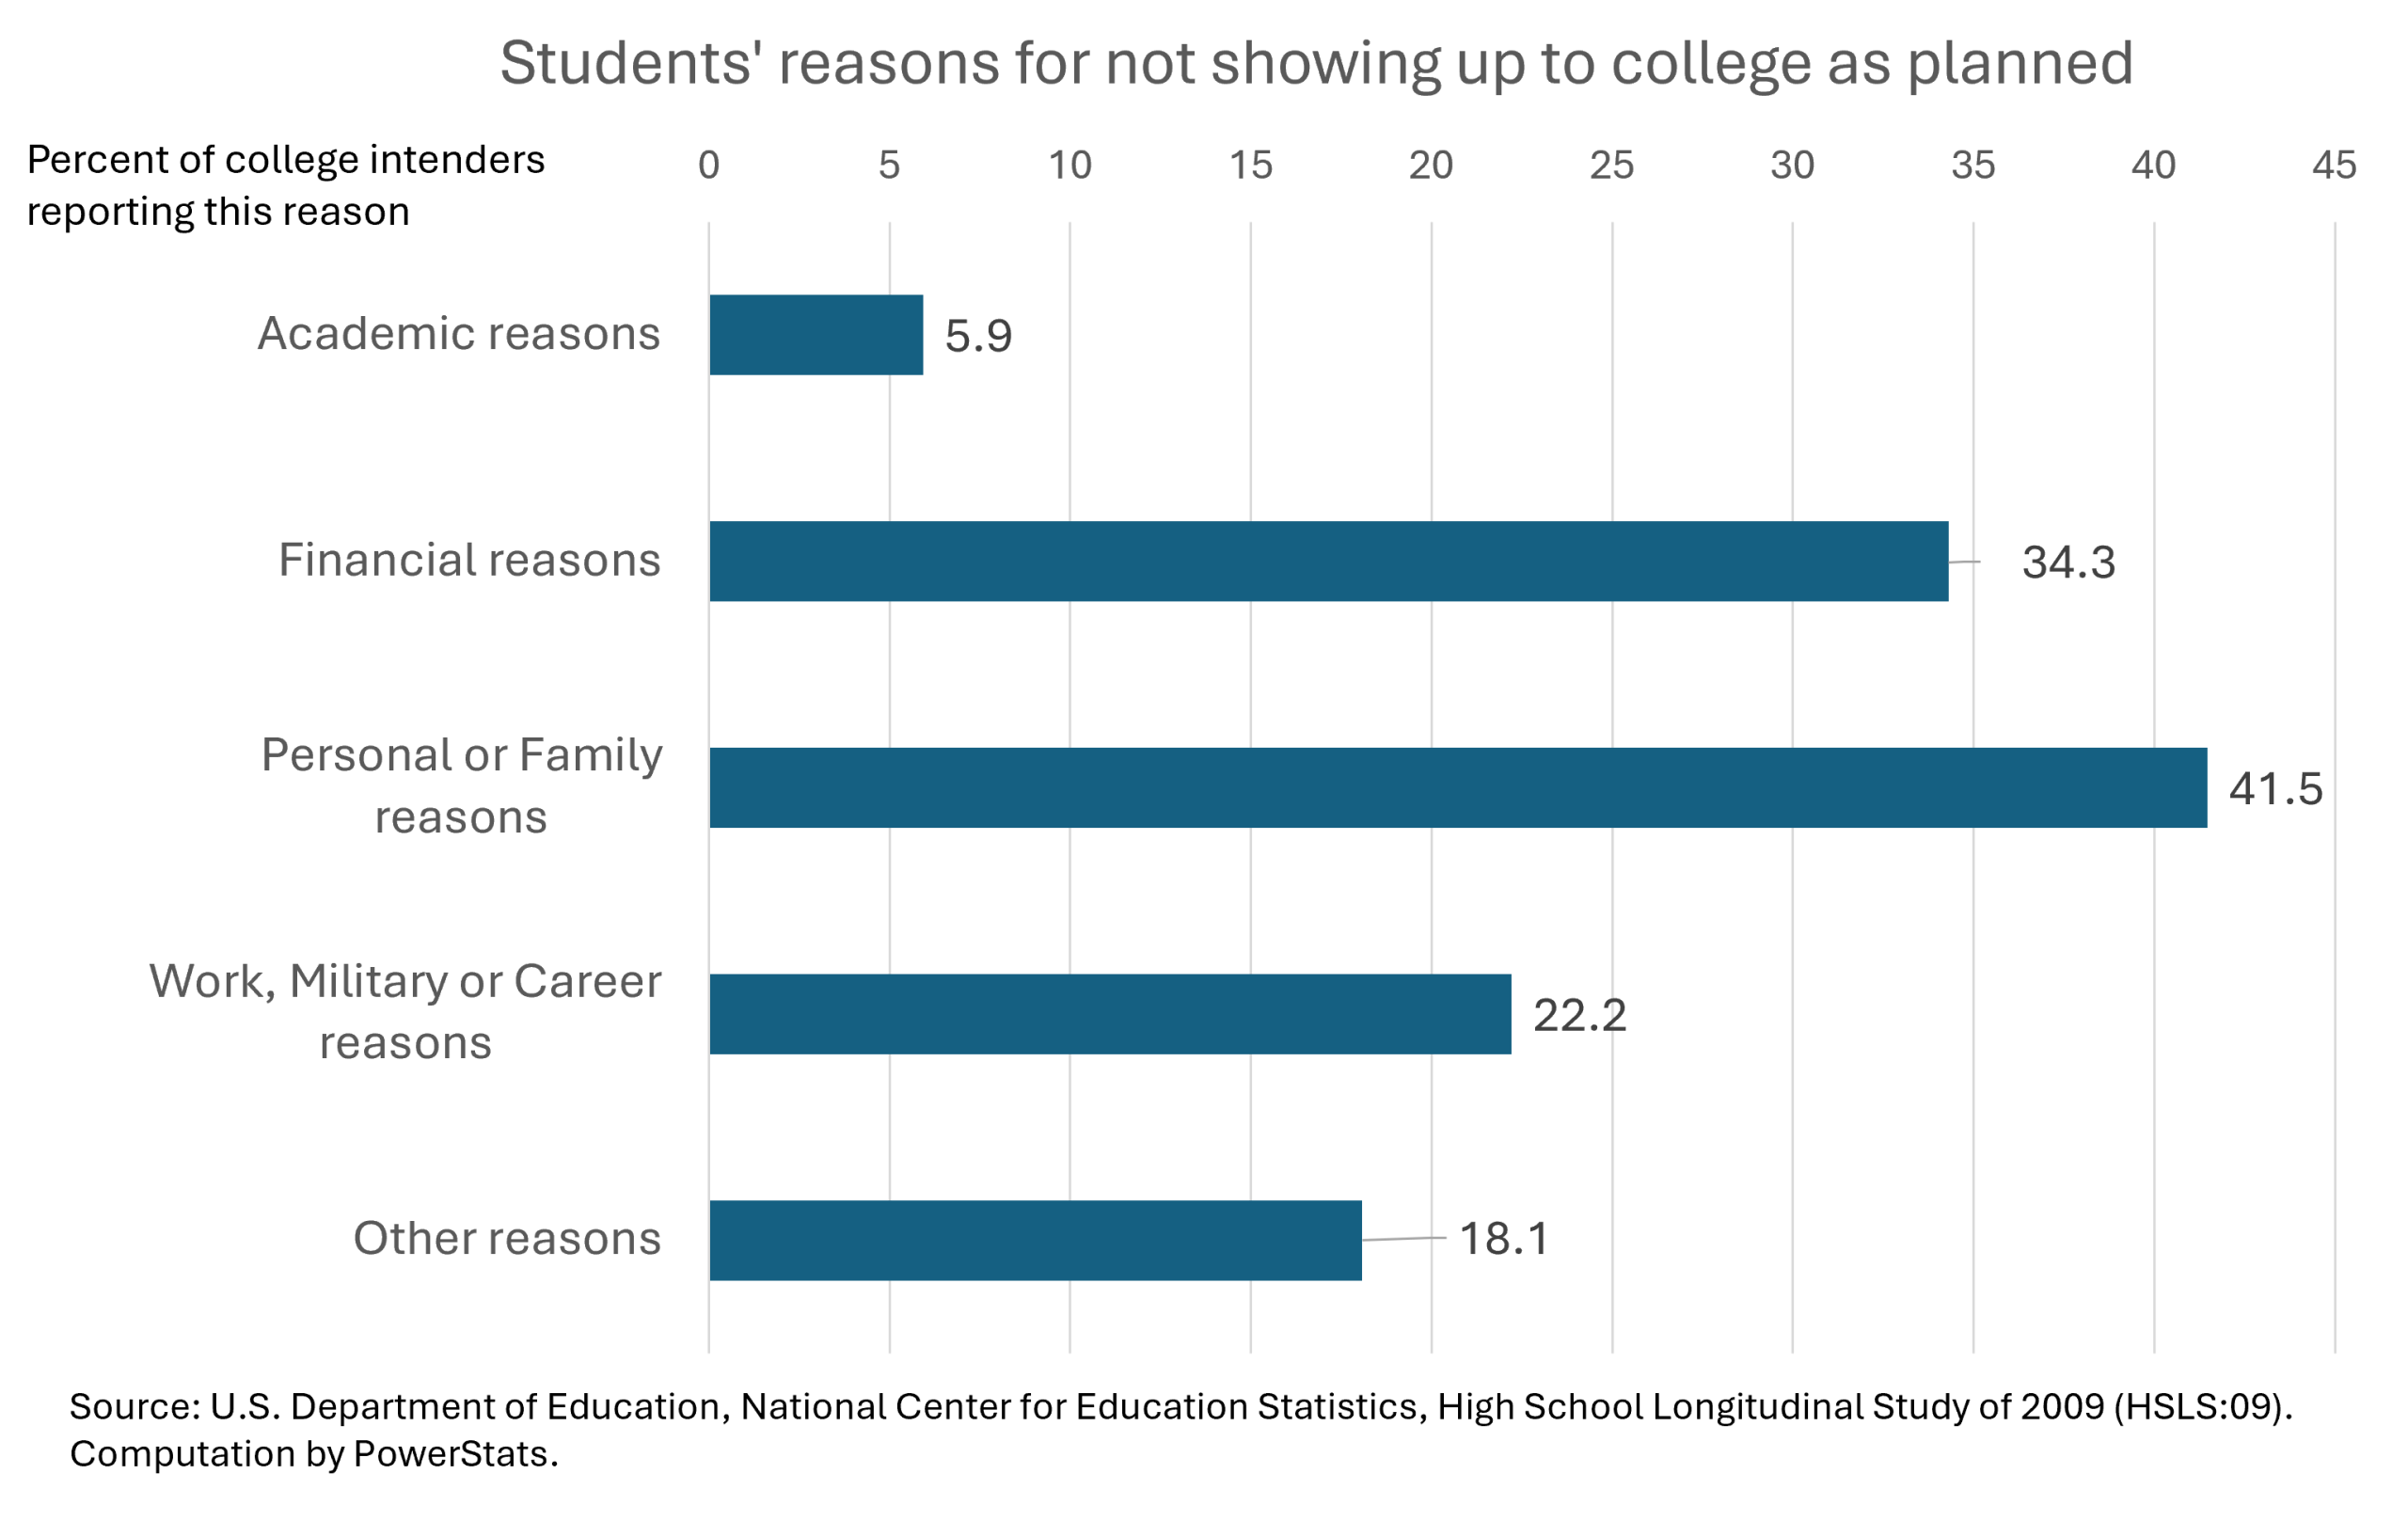
Students’ reasons for not coming to college as planned include a wide range of issues, but the most common are financial and family-related, as reported in the most recent national education survey that followed students transitioning from high school into postsecondary education and the workforce.4 Each student’s reasons are their own, are often combined, and may be weighted differently by factors such as the student’s background characteristics, distance from their intended college, and their social capital.
How do we change the pattern of summer melt?
Interventions like nudges5 and direct outreach from school bridge counselors6 have shown success. Additional incoming student support for the most vulnerable students is an oft-prescribed fix, though this comes at an increased cost for the institution, and so it helps to be precise in targeting student aid.
The landscape of college enrollment is constantly changing, and ongoing data and statistics are needed to understand the extent of these changes. The most recent figures from IPEDS indicate that there is a downward trend in first-time full-time degree enrollment over the past decade. University admissions have changed because of decisions such as the end of the use of race information in admissions7 and changes to federal funding for student loans.8 Students’ beliefs about attendance might also change as what they see in the media and hear from their peers changes.
Continued efforts to collect data about incoming students, understand their motivations and help make things easier for them to stay on course are vital. We must not think that, since the data we have previously collected shed great light on the problem, and interventions targeting these reasons were helpful in moving the needle, that we have “solved” the problem as much as it can be solved. It is important to keep watching the numbers in order to continue to prevent summer melt, not just this summer, but in future summers as well.
- Center for Education Policy Research at Harvard University, https://sdp.cepr.harvard.edu/college-going-toolkit#summer-melt-resources ↩︎
- Many of these were conducted by NCES until recent cuts, such as High School & Beyond, which was planning to ask questions about college enrollment preparations this fall: https://nces.ed.gov/surveys/hsb/
↩︎ - A source for this is the Integrated Postsecondary Education Data System (IPEDS), which collects broad information about college enrollment at the institutional level, but is also threatened by federal cuts. https://nces.ed.gov/ipeds ↩︎
- High School Longitudinal Study of 2009 (HSLS:09), https://nces.ed.gov/surveys/hsls09/ ↩︎
- Castleman & Page, 2014, https://sdp.cepr.harvard.edu/sites/g/files/omnuum4446/files/sdp/files/9_castleman_summertextmessages.pdf ↩︎
- Daugherty 2012, https://sdp.cepr.harvard.edu/sites/g/files/omnuum4446/files/sdp/files/sdp-summer-melt-academic-paper-summer-link1.pdf ↩︎
- Students for Fair Admissions v. University of North Carolina, 2023 and Students for Fair Admissions v. Harvard, 2023 ↩︎
- Reconciliation bill, signed July 2025. https://www.congress.gov/bill/119th-congress/house-bill/1?q=%7B%22search%22%3A%22one+big+beautiful+bill+act%22%7D ↩︎
Leave a Reply