

Why We Need Maps
An anxious group of ‘49ers seeking to cross the Sierra Mountains before winter to find California gold left the “Old Spanish Trail” on the advice of a young man promising a shortcut sketched on a hand-drawn map. On this shoddy advice, the group set off on paths unknown, encountering gaping canyons and the impassable Paramint Range. The detour would cost the “Lost ‘49ers” over a dozen lives and many grueling months suffering hunger and thirst, as they desperately sought signs of civilization, the thought of gold a distant memory (1, 2).
Education agencies face similar choices when determining achievement levels on new and existing assessment systems: What should students know and be able to do to meet the proficiency standard? These new proficiency standards and proficiency rates, determine whether or not students are deemed to be meeting critical levels of achievement associated with short- and long-term educational achievements.
Mapping Destinations: Long-Term Educational Goals
Education agencies routinely track key outcomes:
- on-grade academic achievement
- on-time grade progression
- on-time high school graduation
- college entrance exam results
- college enrollment and completion
- workforce outcomes
Decades of research show that early reading proficiency is strongly associated with later academic success, including graduation, college enrollment, and adult employment earnings (e.g., 3, 4). Although NAEP does not predict individual outcomes, state-level NAEP proficiency rates correlate with stronger long-term educational indicators (5, 6), making NAEP an invaluable map for states, districts, and schools to evaluate how well their systems are performing relative to national expectations.
NAEP Proficiency Rates Provide States with a Road Map for Meeting These Goals
In my last NAEP blog, “The Many Uses of the Main NAEP Study,” we compared proficiency rates on NAEP to those on each of the U.S. state tests, from 2019 to 2024. Here’s a comparison of NAEP proficiency rates on their Grade 4 Reading test to the proficiency rates on the Mississippi MAAP Grade 4 ELA test.
Graph 1: Mississippi ELA Percent Proficient vs. NAEP ELA Percent Proficient, Grade 4, 2019 to 2024
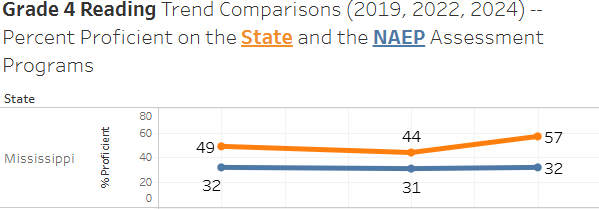
What do these trends say about how well MS Grade 4 (G4) students are performing on ELA? Select one option below. We will revisit this question at the end of this blog.
Quiz!
Question: What does the MS G4 ELA Proficiency Rate Comparison to the MS G4 NAEP Proficiency Rate Say about MS’s Grade 4 ELA Proficiency Rates?
- MS is performing better as a state than what is indicated on NAEP.
- MS’s NAEP proficiency rates are flat showing poor performance on NAEP.
- MS’s reading proficiency rates are stable even during COVID pandemic.
- Results on the two tests cannot be compared as they are based on different sets of standards and have different test blueprints.
Mississippi and NAEP Maps for Grade 4 ELA/Reading
To arrive at our answer, we zoom out and look at the longer-term trends between the MS G4 ELA test and the NAEP Reading test.
Graph 2: Mississippi ELA Percent Proficient vs. NAEP ELA Percent Proficient, Grade 4, 2005 to 2024
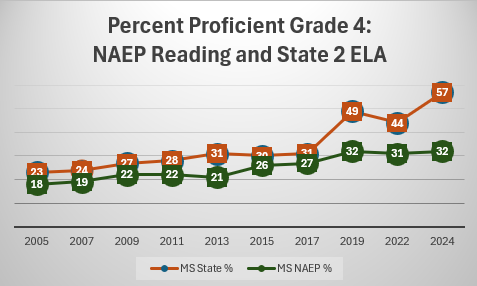
The first thing we notice is the sharp increase in MS’s rate of proficiency in 2019 – what happened?
Graph 3: Mississippi ELA Percent Proficient vs. NAEP ELA Percent Proficient, Grade 4, 2005 to 2024, with Testing Changes
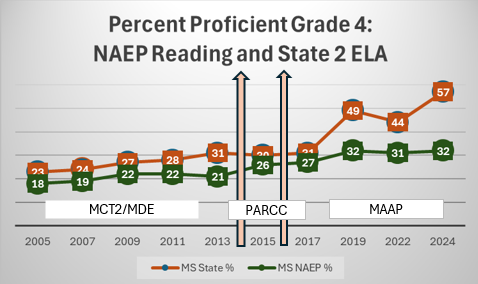
Well, it appears that in switching tests, to the MAAP (the MS Academic Assessment Program) from the MCT2 (MS Curriculum Test, Second Edition) and, briefly, from PARCC (Partnership for Assessment of Readiness for College and Careers), MS lost some of its measurement continuity. Continuity is one of the important features of the NAEP assessments. While the Main NAEP assessment does make periodic updates to its Reading and Mathematics assessments to reflect changes in educational technology and standards, NAEP conducts rigorous linking studies to ensure a high degree of equivalency between the pre-revision test scale and the post-revision test scale. States often do not have the type of resources to pull off this hat trick, resulting in discontinuities between the pre-revision and the post-revision test scales. In other words, NAEP provides the kind of strong, long-term consistency in its measurement scales and results that many state tests struggle to achieve.
Although there has been legitimate criticism in how the Main NAEP Proficiency Achievement levels were set; namely, that NAEP proficiency levels indicate too high a level of achievement (7), NAEP assessment resources and reports render the NAEP proficiency standard a useful benchmark or educational map that states can use to see if they are staying on track with their educational initiatives and outcomes, or if they are veering off in the wrong direction.
As we can see in Graph 2, proficiency rates on the G4 MCT2 and PARCC ELA tests tracked closely with those on NAEP, indicating that the expectations associated with proficiency on those tests were similar to proficiency expectations on NAEP. While the proficiency expectations on the MS G4 ELA tests show a sharp increase on the MAAP test (e.g., veering off into another direction), MS’s G4 NAEP Reading Proficiency rates have held steady, indicating that the state’s grade 4 students have not lost ground since the pandemic.
As we can see in Graph 3, proficiency rates on the G4 MCT2 and PARCC ELA tests tracked closely with those on NAEP, indicating that the expectations associated with proficiency on those tests were similar to proficiency expectations on NAEP. While the proficiency expectations on the MS G4 ELA tests show a sharp increase on the MAAP test (e.g., veering off into another direction), MS’s G4 NAEP Reading Proficiency rates have held steady, indicating that the state’s grade 4 students have not lost ground since the pandemic.
Criticisms of Using NAEP Benchmarks to Monitor State Test Results
Despite the strong potential of NAEP Benchmarks, some critics may say such comparisons aren’t valid due to differences in academic standards, or differences in testing blueprints between the individual state tests and the NAEP tests. Similarly, some school districts may say that comparisons to state results aren’t valid due to curricular differences, or differences between the school demographics and the state demographics.
NAEP Draws Representative Samples for Each State
Let’s tackle the demographics differences criticism first – starting with NAEP. Because NAEP pulls a representative sample for each state, student demographics on the NAEP assessment should be similar to that found on the state assessment, easing concerns about demographic differences. Demographic differences do come into play when comparing local test results to state test results. This is because there are well-known demographic differences between average state and local demographics. For example, large urban districts tend to have more students classified as low-income and as English language learners, for example. In such cases, it is often necessary to compare percent proficiency within each demographic group when the local student demographics are very different from the state student demographics, or to examine student growth statistics like “Student Growth Percentiles (SGPs)” which will show average local gains on the state test. Districts with local average SGPs of 50 show that, on average, students are making typical gains on the test from one grade to the next. Average SGPs of 55 or higher would indicate above-average gains. But because NAEP bases its proficiency estimates on representative samples in each state, demographic differences do not factor into these NAEP comparisons. We can move onto the next concern.
Comparing Test Blueprints
Now let’s address the concern that differences in standards taught and assessed at the state or local levels are too great to compare results to the national or state assessments. To address this concern, we can compare several components of the state/local vs. the national/state assessment programs:
- Test Blueprints
- Assessment Standards
- Assessment Items
We’ll take a look at comparing Assessment Standards and Assessment Items in later blogs. To compare test blueprints, we estimated the percentage of tested points assigned to each reporting category, as well as other components of the test, as described in their respective test blueprint descriptors provided in (8 and 9). The test point percentages by reporting category for the G4 tests are shown in Table 1.
Table 1: Test Blueprint Comparisons, Grade 4 ELA/Reading Tests, MS vs. NAEP
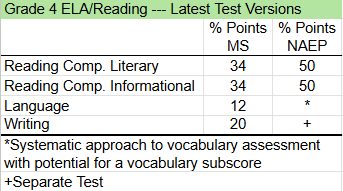
Let’s start with the differences: recall that the NAEP Reading Assessment tests only that content domain – most notably, an assessment of Writing is not included on the NAEP Reading tests.
Language items are included on the test, but they are not assigned a separate reporting category, and are instead used to inform the reading subscores. The MS MAAP tests in ELA do provide a separate reporting category score for Language, as well as for Writing.
Now for the similarities: Both the MAAP and NAEP tests assess reading comprehension within the contexts of reading passages, and both tests use 50% Literary Reading passages and 50% Informational Reading passages, with assessed standards geared toward each type of reading passage.
Passage difficulty is another variable affecting test difficulty described in the test blueprint documents. Here, NAEP reading passages are somewhat more difficult than the reading passages on the MAAP, as MAAP targets passages at Grade 4 passage difficulty and NAEP targets early Grade 5 passage difficulty.
Mapping to Long-Term Educational Goals
So far, we have demonstrated there is much overlap between the two grade 4 ELA/Reading tests in terms of the way reading comprehension is assessed, although the NAEP assessments do appear to be a bit more difficult than the MAAP tests. NAEP is a serviceable map, a benchmark for states in determining whether or not they are achieving the short and long-term objectives of on-grade academic achievement, on-time grade progression and graduation, and college enrollment.
In Mississippi, the NAEP benchmarks have proven invaluable for providing evidence that the state’s Literacy Initiatives have been a success. MS used the NAEP benchmark to track changes associated with its statewide Literacy-Based Promotion Act. The Act required early identification of struggling readers, intensive reading interventions, and retention of third graders who did not meet reading benchmarks (with targeted exemptions). The Mississippi Department of Education invested a reported $15 million per year in coaching for teachers and introducing other early literacy programming, including embedding literacy coaches in the lowest-performing schools, providing high-quality instructional materials, and ensuring that teacher training programs aligned with research-based reading instruction. The success of Mississippi’s approach—its Grade 4 NAEP reading scores rose faster than almost any other state between 2013 and 2019 (with rankings in g4 reading that went from last to 9th place) also provided evidence for the efficacy of the national “Science of Reading” movement (10 – 13).
Good Academic Benchmarks Encourage Investing in Students
Estimated returns on the Literacy-Based Promotion Act investments include that students gained approximately one-quarter of a year of literacy, translating to an extra one thousand dollars a year in lifetime earnings, per student, or approximately a $32 return for every $1 spent on the program (14).
This brings us to the cost of NAEP and other federally-funded educational benchmarking studies. Clearly, NAEP’s costs of $151 million (in 2019) is very small, and well-worth it, compared to the benefits these benchmarks confer to policy makers, educators, and students.
When we have benchmarks like NAEP, states have greater confidence in investing in students. Reliable maps matter. When states make changes to their programming, curriculum, or assessments, they can monitor their score trajectories using NAEP to determine if things are going as desired, or if student outcomes are veering “off course.”
Quiz! (Revisited)
Now let’s revisit our quiz question one more time. After reading this blog – has your response changed?
Question: What does the MS G4 ELA Proficiency Rate Comparison to the MS G4 NAEP Proficiency Rate Say about MS’s Grade 4 ELA Reading Proficiency Rates?
- MS is performing better as a state than what is indicated on NAEP.
- MS’s NAEP proficiency rates are flat showing poor performance on NAEP.
- MS’s reading proficiency rates are stable even during COVID pandemic.
- Results on the two tests cannot be compared as they are based on different sets of standards and have different test blueprints.
The correct answer is: C. Mississippi’s proficiency rates have remained stable even during the COVID pandemic.
Explanations:
A: The proficiency rate on the MS test is higher than NAEP’s, particularly since 2019; but this only indicates that the state test has a more lenient definition of proficiency.
B: Although MS’s NAEP proficiency rates have leveled off in recent years, MS’s NAEP proficiency rates on the grade 4 Reading test has risen more than other other state’s, and has maintained these gains even during the COVID pandemic.
C: Take a look at the Tableau Workbook to see that Mississippi is one of the few states with proficiency rates that have been stable during the Covid pandemic.
D: We have demonstrated fairly strong comparability blueprints.
References/Footnotes
- Map Image: Discover Our Parks. (2021, March). Map of the Lost ’49ers: Rough Path of the Lost ’49ers [PDF]. Retrieved from Death Valley National Park. (n.d.).
- The “Lost 49ers” of 1849. National Park Service interpretive history.
- Hernandez, D. J. (2011). How Third-Grade Reading Skills and Poverty Influence High School Graduation (“Double Jeopardy”). Education report. ERIC.
- NAGB / NAEP. NAEP Achievement Levels Validity Argument Report (recent evaluation and synthesis of validity evidence for NAEP achievement levels). (2025). PDF.
- Doty, E., Kane, T., & Staiger, D. (2025). What Do Changes in State NAEP Scores Imply for Birth Cohorts’ Later-Life Outcomes? Journal of Policy Analysis and Management. (Cohort-level analysis: a 1-SD increase in NAEP 8th-grade math is associated with ~8% higher adult earnings, plus better education, lower incarceration, etc.)
- National Assessment Governing Board (NAGB). Powered by NAEP: Economic Brief. (2024) —Research linking NAEP gains to long-term economic and social benefits, including income, education attainment, and reduced incarceration.
- ASCD — “The Problem with ‘Proficient” — argues that NAEP’s proficiency benchmarks are flawed and mislead the public about student performance.
- National Assessment Governing Board (NAGB). Reading Framework for the 2019 National Assessment of Educational Progress. PDF. February 2019.
- Mississippi Department of Education. (2021). 2021–2022 MAAP English Language Arts Assessment Blueprint.
- Mississippi First. “The Truth About Mississippi’s NAEP Gains.” (July 5, 2023) — a state-based analysis describing timing and magnitude of gains.
- Mississippi Department of Education (MDE). Literacy-Based Promotion Act (LBPA) — Office of Elementary Education and Reading. (program overview and state resources).
- Chalkbeat. Moore, A. & Bellware, K. “Mississippi saw big gains on the NAEP. But why?” (July 18, 2023).
- Mississippi Today. Skinner, K. “Mississippi students No. 1 in the country for reading gains” (Oct 30, 2019)
- Patrinos, H. A. (2025, March 26). Mississippi’s education miracle: A model for global literacy reform. Phys.org.
Leave a Reply