
By: Kathleen Flanagan, Ph.D.
Department of Education Cuts
The Federal Department of Education (ED) was largely decimated by the 2025 DOGE budget cuts. Staffing at the National Center for Education Statistics (NCES), the research and measurement arm of ED responsible for running the federally mandated NAEP Program (e.g., the National Assessment of Educational Progress), was cut by 97%, resulting in a staff of only 3 employees, down from over 100. This has us asking: What does NCES do? What is NAEP? And why should we care?
The primary focus at NCES is to monitor and report on the outcomes of schools in the U.S. – both public and private – through large-scale data collection and analysis efforts. NCES provides reports and other educationally beneficial resources to the nation’s school systems and educators. In its most prominent assessment project, NAEP, working with NAGB (the National Assessment Governing Board), NAEP has published educational frameworks and assessment materials, including released items, in all of the assessed areas. We will cover each of these aspects of the NAEP program in this six-part blog series. In this introduction, we take a look at NAEP’s reporting of educational progress in its long-term trends, and the main NAEP reporting study that includes state comparisons.
NAEP Long-Term Educational Trends
NAEP reports long-term trends for students aged 9, 13, and 17 in two subject areas: Reading and Math. NAEP started reporting national trends in Reading in 1971 (!) and Mathematics in 1973. NAEP’s last long-term trend reports were done from 2022 to 2023. These NAEP trends tell a lot about the state of education in the U.S. in these two subject areas. Let’s dig into the latest trend reports.
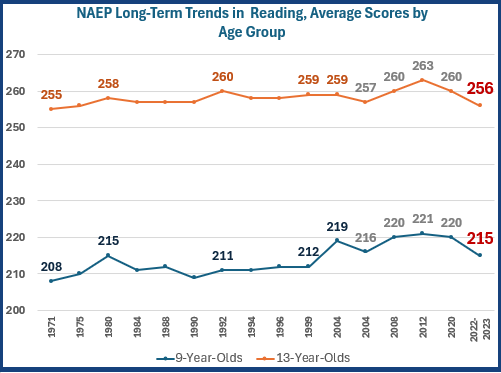
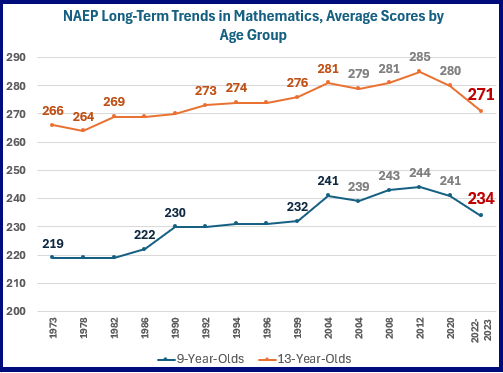
The two charts below show the long-term trends in Reading, then in Mathematics, for the 9- and 13-year olds. The scale score ranges for the two trend programs are 0 to 500. The scale is a longitudinal one where scores and average scores for 9-, 13-, and 17-year-olds are placed onto the same scale; the overall averages for older students are higher than for younger students, as indicated in the graphs.
Many of these average trends appear to track with a number of standards-based reforms, designed to improve student achievement in the 1980s to the 2010s. For example, in Reading for 9-Year-Olds, average scores started out at 208 in 1971 and increased to 221, at the height of standards-based reforms with the introduction of the Common Core State Standards in 2011. The average scale score trends also reflect educational disruptions. Most notably, the lack of face-to-face schooling resulted in sharp drops on all of these trendlines in 2022 and 2023, the years since the pandemic.
Click on each chart to watch a YouTube video summarizing additional information associated with each set of trendlines.
NAEP Long-Term Trends for Reading and NAEP Long-Term Trends for Mathematics
NAEP is the best vehicle for systematically checking on U.S. trends in Reading and Mathematics. NAEP’s published materials assist U.S. schools with improving student outcomes. This blog series will demonstrate how NAEP resources can be used to check on and increase expectations in all U.S. school systems.
NAEP Frameworks
In addition to Reading and Mathematics, NAEP has published educational frameworks, assessment content, and student results on ten other academic domains, including: Science, Technology and Engineering Literacy, Civics, Economics, Writing and Geography. In this blog series, we will show educators how to leverage large-scale assessment content to inform local education practices. For example, we will introduce a content alignment process in geography, leveraging the NAEP Geography Frameworks, while also include other state and national frameworks in geography.
International Trend Studies to Use to Benchmark U.S. Standards and Expectations
The U.S. also participates in multiple international K-12 education trend studies that allow the U.S. to check its standards against those of other countries throughout the world. Some of these studies include:
- TIMSS: the Trends in International Mathematics and Science Study, measures the mathematics and science achievement of U.S. students compared to that of students in other countries. TIMSS data have been collected from students at grades 4 and 8 every 4 years since 1995. TIMSS is a worldwide study sponsored by the International Association for the Evaluation of Educational Achievement (IEA).
- PISA: The Programme for International Student Assessment (PISA) is a worldwide study conducted by the Organisation for Economic Co-operation and Development (OECD) in member and non-member nations. The study measures 15-year-old school pupils’ scholastic performance on mathematics, science, and reading.[1] It was first performed in 2000 and repeats every three years.
- PIRLS: The Progress in International Reading Literacy Study is an international assessment and research project designed to measure reading achievement at the fourth-grade level, as well as school and teacher practices related to instruction.
- ICILS: The International Computer and Information Literacy Study measures the digital competencies of 8th-grade students and contextual factors regarding digital literacy education.
In the Mathematics video (above), we demonstrate how TIMSS trends pick up on some of the same score improvements and decreases as the NAEP long-term trends do.
NEXT UP: Using the NAEP state studies in Reading and Mathematics to monitor state proficiency levels in these subject areas.
Footnotes: a) IES, the Institute of Education Sciences is another branch of ED. We will discuss IES in a future blog. b) NCES conducts other academic and non-academic long-term studies, in addition to NAEP. We will showcase some of these studies in a future blog series.
Leave a Reply